[root@linux vnstat]# vnstat --help vnStat 2.8 by Teemu Toivola <tst at iki dot fi>
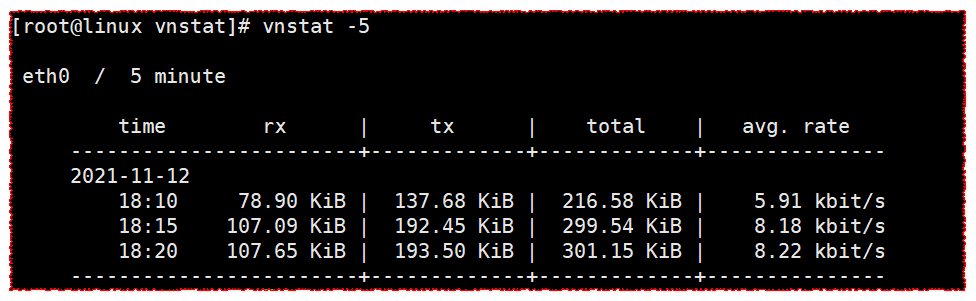
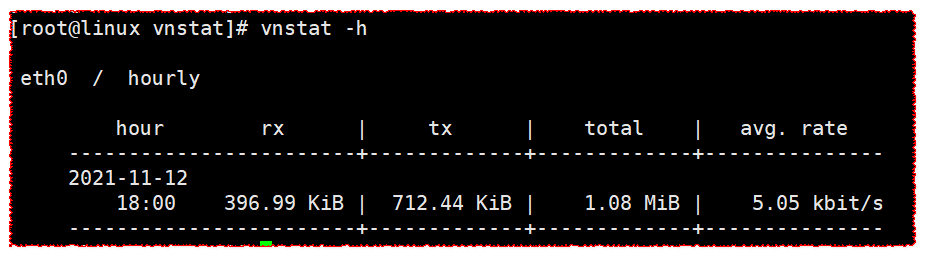
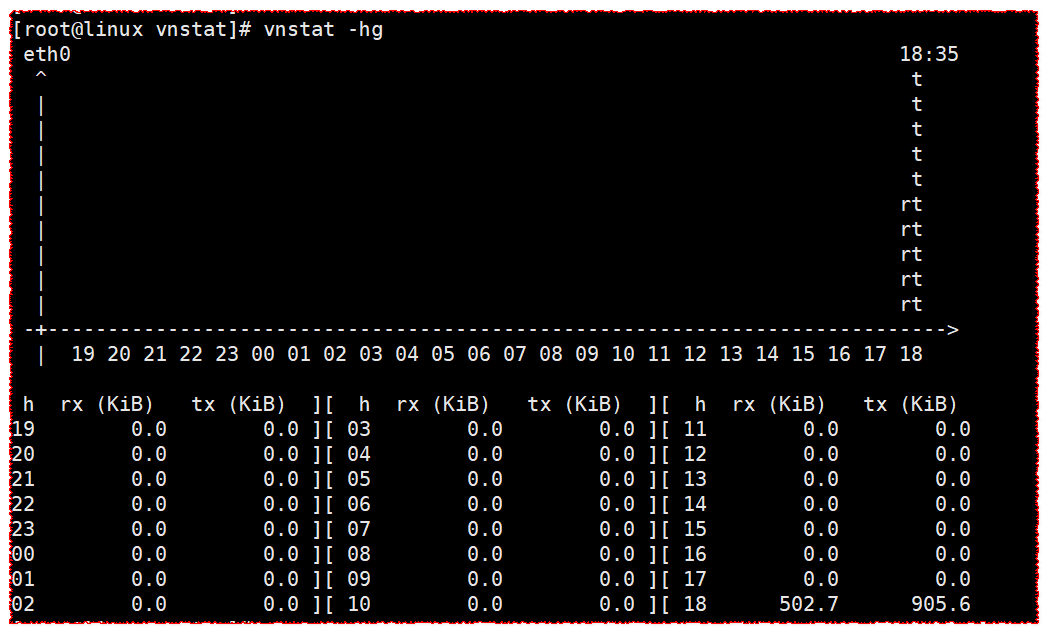
-5, --fiveminutes [limit] show 5 minutes -h, --hours [limit] show hours -hg, --hoursgraph show hours graph -d, --days [limit] show days -m, --months [limit] show months -y, --years [limit] show years -t, --top [limit] show top days
-b, --begin <date> set list begin date -e, --end <date> set list end date
--oneline [mode] show simple parsable format --json [mode] [limit] show database in json format --xml [mode] [limit] show database in xml format
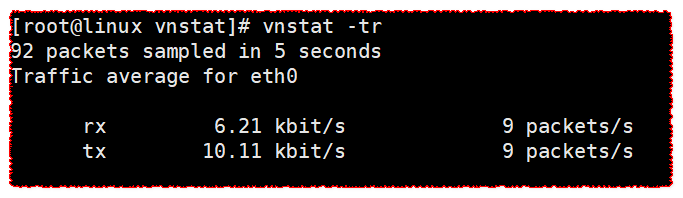
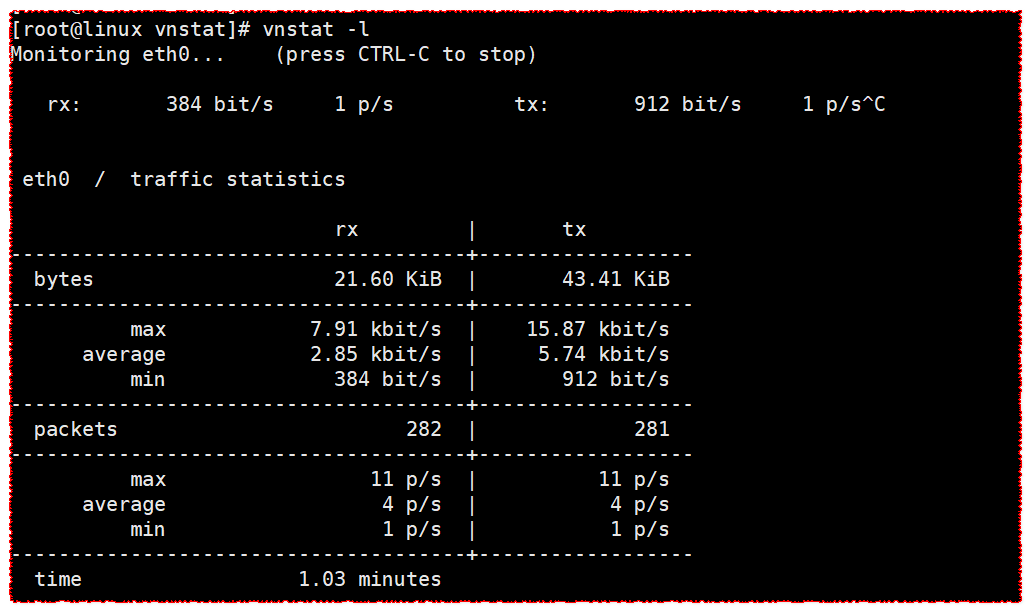
-tr, --traffic [time] calculate traffic -l, --live [mode] show transfer rate in real time -i, --iface <interface> select interface
Use "--longhelp" or "man vnstat" for complete list of options.
1.2.2. vnstat
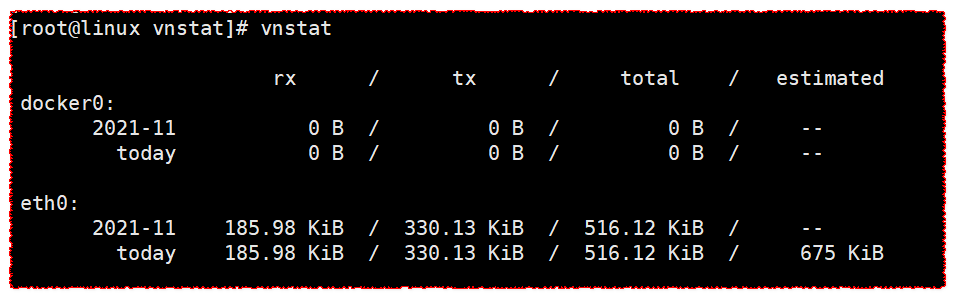
查看所以接口流量统计情况
1 2 3 4 5 6 7 8 9 10
[root@linux vnstat]# vnstat
rx / tx / total / estimated docker0: 2021-11 0 B / 0 B / 0 B / -- today 0 B / 0 B / 0 B / --
# CentOS # 方法一 wget http: //www.sqlite.org/sqlite-autoconf-3070500.tar.gz tar xvzf sqlite-autoconf-3070500.tar.gz cd sqlite-autoconf-3070500 ./configure make make install
# 方法二: yum install -y sqlite-devel
# 方法三: yum install -y sqlite3-ruby
查看版本信息:sqlite3 -version 终端进入命令:sqlite3
1.3.2. 错误二
1
configure: error: no acceptable C compiler found in $PATH
解决方法
Ubuntu
1 2
# Ubuntu apt-get install gcc gcc-c++
CentOS
1 2 3 4 5 6 7 8 9 10 11 12
方法一 yum -y install gcc gcc-c++
方法二 wget http://ftp.mirrorservice.org/sites/sourceware.org/pub/gcc/releases/gcc-9.4.0/gcc-9.4.0.tar.gz tar zxf gcc-9.4.0.tar.gz cd gcc-9.4.0 yum -y install bzip2 ./contrib/download_prerequisites ./configure --disable-multilib --enable-languages=c,c++ make -j 4 make install
错误三
1
2
error: Cannot download mpfr-3.1.4.tar.bz2 from ftp://gcc.gnu.org/pub/gcc/infrastructure/
error: Cannot download mpc-1.0.3.tar.gz from ftp://gcc.gnu.org/pub/gcc/infrastructure/
1
error: Cannot download gmp-6.1.0.tar.bz2 from ftp://gcc.gnu.org/pub/gcc/infrastructure/